Getting started with pandas in python.
Photo by Tim Swaan on Unsplash
Pandas is one of the most popular python libraries. It was built on two core python libraries
a) Numpy - To perform mathematical operations
b) matplotlib - To visualize the data
Pandas library is used in data exploration - from understanding what is inside the data to visualize the data.
Pandas support two data structures,
a) Series
b)Data frame
Series is a one-dimensional labeled array holding any type of data.
Data frame is a two-dimensional structure with data arranged in the form of rows and columns.
Let's start with the data frame basic analysis.
1. Importing pandas library
Before we start using pandas for data exploration we need to import the pandas library
import pandas as pd
2. Importing data from excels
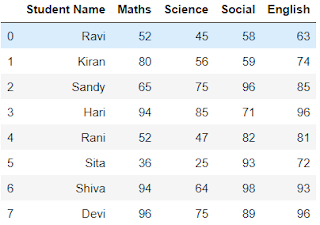
As most of the data were saved in an excel file, let's get started with excel. I have created an excel file with student names and their corresponding marks in different subjects. In total, we have 9 students with corresponding marks in four different subjects in the table.
Syntax:
pd.read_excel(r' path to the excel file ')
Here r stands for raw strings, it is generally given to avoid unicode error
Ex :
data=pd.read_excel(r'F:\Python\Student_Marks.xlsx')
To check the data imported from excel, print the variable
print(data)
or
data
Output:
3. Creating data frames in python pandas
Creating a data frame of random data with index and column names. Dataframes are the data structure that includes rows and columns.
Syntax:
pd.DataFrame(Data, index,columns)
Ex: Creating a data frame of data imported using excel
df=pd.DataFrame(data)
In this example, we created a data frame variable as df. When the index is not provided, python by default provides numbers as index starting with 0. Columns will same as in the excel data.
Output:
4. Checking the first few rows of the data frame
Syntax:
data_frame_variable .head( number of rows need to be displayed from top of the table)
Earlier we created a data_frame_variable called df. So let's use it.
a) By default the head() function will provide first 5 rows of the data frame
df.head()
Output:
b) To get the first 8 rows of the data frame we need to specify the number of rows as arguments in the head function
df.head(8)
Output:
5. Checking the last few rows of the data
Syntax:
data_frame_variable.tail( number of rows need to be displayed from the bottom of the table)
a) By default the tail() function will provide the last 5 rows of the data frame
df.tail()
Output:
b) To get only the last 3 rows of the data frame, we need to specify the number of rows as arguments in the tail function
df.tail(3)
Output:
df.tail(3) will show the last three rows of the table or data frame.
6. To get all the column names in the data frame
df.columns
Output:
7. To get the index values in the data frame
df.index
Output:
8. To know the data type of the columns in the data frame
Syntax:
df.dtypes
Here the names of the students in our example are string and python displays the data type of columns with string as object. As marks are numbers the datatype of marks in int64.
9. Finding the missing values in the table
a) Syntax:
df.isnull()
This syntax will return the boolean values corresponding to the values in the data frame. If there were no missing values it will return "False" and if the data has missing values the syntax will return "True".
Output:
In this example, there were no missing values and therefore it returns False.
b) To find the number of missing values in each column of the data
Syntax:
df.isnull().sum()
Output:
Since there were no missing values in the data, the number of missing values in each column is zero.
10. To get the statistics of the data frame
Syntax:
df.describe()
Output:
describe() function will return the five-number summary along with the count, mean and standard deviation of each column in the data.
count indicates the number of rows in the data frame.
The five-number summary indicates
1. Minimum,
2. First quartile -- Q1 (25th percentile),
3. Second quartile is also known as median -- Q2 (50th percentile),
4. Third quartile -- Q3 (75th percentile)
5. Maximum.
This five-number summary is used to identify the outliers in the data.
Thank you for reading and Happy learning ...


Comments
Post a Comment